A few days ago I stumbled upon a funny graph (there) plotting life expectancy at birth vs health care spending in various OECD countries, which pointed out how much the USA were off the chart, with about $8000 health care spending per capita per year and a life expectancy around 78 years, while for instance Denmark achieves a slightly longer life expectancy with less than $5000 health care spending per capita per year (which is still a below average ratio). Note that the currency conversion is done using purchasing power parity.
Digging a bit into this I eventually found the data source, OECD Health Data 2011 – Frequently Requested Data, and even some R source code to plot the thing.
So I loaded the latest data, which as of today are more or less complete up to year 2009 (too many missing data for year 2010 and 2011 yet), adapted the script a bit, and here’s an up-to-date plot:
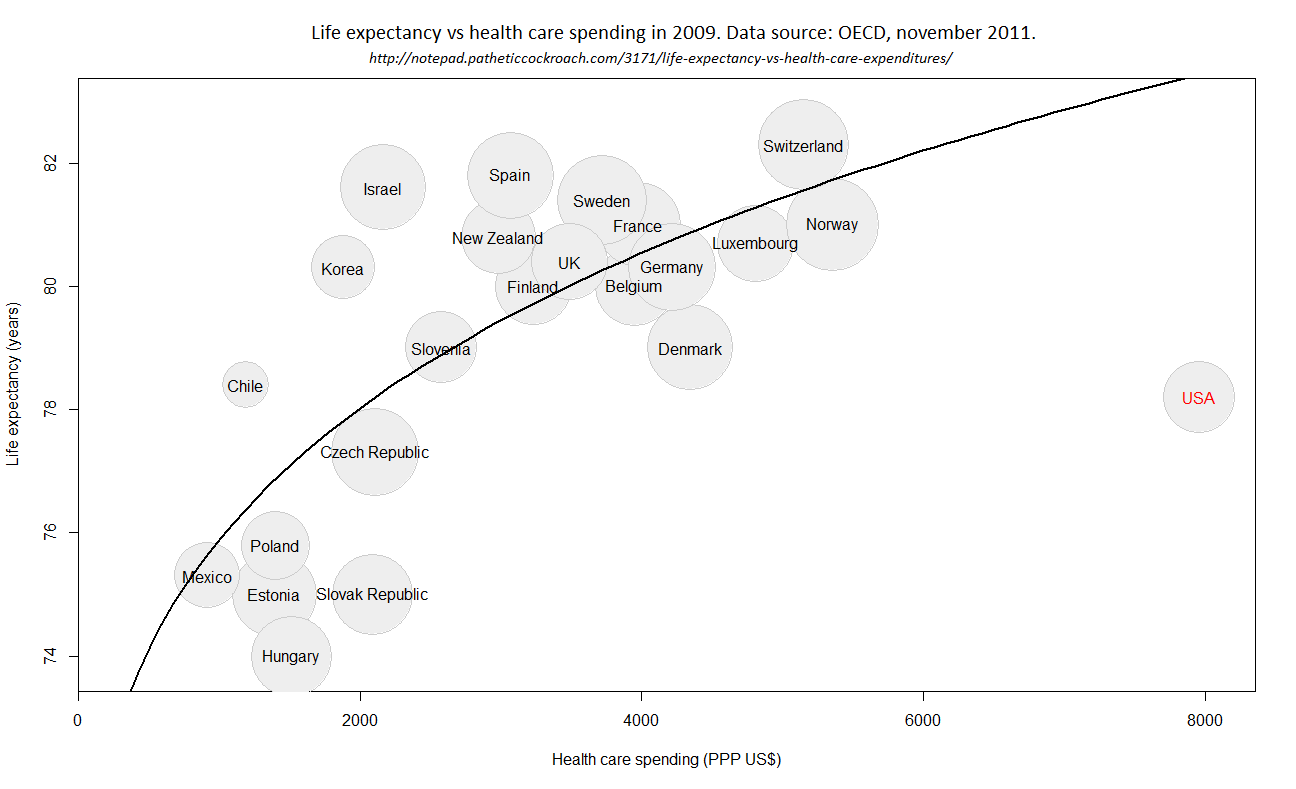
The circles’ diameters are proportional to physician density. Note that Japan is missing (in the graph I mention at the beginning of this post, Japan is featured as a positive outlier, but its data are missing for year 2009), as well as a few other countries due to missing data. I also removed some more because of overlapping points.
And here’s the source (note that you’ll need to move the data from the Excel file a bit into a properly crafted CSV file):
library('penalized');

OECDdata=read.csv("OECD2011-11.csv");


countries=as.character(OECDdata[,1]);
N=length(countries);
expenseGDPperc=OECDdata[,2];
expenseUSDPPP=OECDdata[,3];
lifeExpTot=OECDdata[,4];
physicianDensity=OECDdata[,5];
physicianDensity[is.na(physicianDensity)]=OECDdata[is.na(physicianDensity),6]; # si NA, on prend les données 2008
physicianDensity[is.na(physicianDensity)]=OECDdata[is.na(physicianDensity),7]; # si tjs NA, on prend les données 2007

color=rep("#000000",N);
color[countries %in% c("United States")]="red";
circlebg=rep("#eeeeee",N);
circlefg=rep("#cccccc",N);

remove = rep(FALSE,N);
remove = countries %in% c ("Netherlands", "Belgium", "Germany","Ireland", "Iceland", "Greece", "Italy", "Sweden", "Finland");
remove = countries %in% c ("Netherlands", "Ireland", "Austria", "Iceland");

countries[countries=="United States"]="USA";
countries[countries=="United Kingdom"]="UK";

plot(expenseUSDPPP, lifeExpTot, xlim=c(0,1.05*max(expenseUSDPPP,na.rm=TRUE)), xaxs="i",type="n",
     xlab="Health care spending (PPP US$)", ylab="Life expectancy (years)");
symbols (expenseUSDPPP[!remove], lifeExpTot[!remove], circles=sqrt(physicianDensity[!remove]),
         inches=.8, add=TRUE, fg=circlefg[!remove], bg=circlebg[!remove]);
text (expenseUSDPPP[!remove], lifeExpTot[!remove], countries[!remove], col=color[!remove]);

cor.test(expenseUSDPPP,lifeExpTot,na.rm=TRUE);
lifeExpTot2=lifeExpTot[-which(is.na(expenseUSDPPP)|is.na(lifeExpTot)|countries=="USA")];
expenseUSDPPPb=expenseUSDPPP[-which(is.na(expenseUSDPPP)|is.na(lifeExpTot)|countries=="USA")];
expenseUSDPPPb2=expenseUSDPPPb^2;
expenseUSDPPPb05=expenseUSDPPPb^0.3;
regProba=penalized(response=lifeExpTot2,penalized=~ expenseUSDPPPb + expenseUSDPPPb05,lambda1=1,lambda2=1);
plotLineX=seq(0,1.05*max(expenseUSDPPP,na.rm=TRUE),length=100);
lines(x=plotLineX,y=regProba@unpenalized[1]+regProba@penalized[1]*plotLineX+regProba@penalized[2]*plotLineX^0.3,lwd=2);

As this page is still getting quite a bit of attention, I think I should precise that life expectancy is quite a bad indicator of healthcare system goodness. I only published this graph for the R exercise and because the USA are a funny outlier on it. I don’t really think there’s more to it.